Performance Logging
Monitors
The Performance Logging procedure monitors and logs the Performance of a Controller Action in its entirety and at different parts. The whole Monitor consists of the following sub-monitors :
Controller Action Monitor
The Controller Action Monitor, when enabled, monitors the performance of an Action from its beginning (OnActionExecuting) until its end (OnActionExecuted).
The measurements taken are:
- Time, in milliseconds, that elapsed during its execution
- CPU usage, in percentage, for the current process
- Virtual RAM usage, in bytes, for the current process
- Front-End Statistics that measure the performance of the functionality running at the front-end, as well as the browser's metrics, that are further categorized into:
- UI Render Statistics, presenting the time (in milliseconds) required for the browser to load all the graphics
- Update View Model statistics, presenting the time required for the front-end functionality to obtain the stringified JSON Model from the Back-End, optimize it, dehydrate it and convert it into the actual View Model used by the Form
- Model Assignment Statistics, presenting the time required for the View Model to be initialzed and hydrated by its original representation
- Rule Engine Statistics, calculating the time needed for all the Rules (Conditional Formattings, Data Validations, Calculated Expressions), designed to run when the form Loads, to be executed successfully
- Controller Action Execution Statistics, keeping the time required for the success callback of any Back-End call to be executed
- Database Statistics that ran during the current process and that are further categorized into
- Session Statistics, presenting:
- The maximum time for a Query Execution
- All entities
- All Collections
- Number of various Statements that where run (for example X Close Statements, Y Delete Statements)
- Number of Connections, Transactions and Sessions
- Number of Query Executions and Query Cachings and more
- Entities Statistics, for all (or some) Entities and Collections, presenting:
- Number of Insertions, Updates and Deletions
- Number of Fetches and Loads
- Number of Optimistic Failures (for Entities) and Recreations (for Collections)
- Session Statistics, presenting:
Database Flush Monitor
The Database Flush Monitor monitors the Time that a DB Flush took to be executed, as well as the Database Statistics that ran during that process.
Data Monitors
The Data Monitors measure the Time that elapsed during a data conversion from one type to another. In cases that the conversion fetches data from the Database, it also calculates the Database Statistics that where captured during said conversion. There are several Data Monitors that can be categorized as:
Client Data Monitor
Logs the size of the Data sent from the Client to the Back-End of the Application and measures the time that it took to Deserialize the received JSON string into its ViewModelDTO representation
DTO to ViewModel Conversion Monitor
Captures and logs the time that elapsed during the Conversion of the ViewModelDTO into its equivalent Model, filled with more Database data if needed. Since the Database is hit as well, it logs the Database statistics that where captured during said transformation.
Response Monitor
Logs the size and time that elapsed during the Serialization of the Action's result into its JSON representation. The Response Monitor runs in two flavors, depending on the outcome of the Action:
- A Pre-Action Response Monitor that calculates the aforementioned statistics in the case of an early exit; for example, when the Controller's Action is stopped due a Validation Error.
- A Post-Action Response Monitor that calculates statistics in the case of a normal Action execution, when the Controller Action is fully executed and the results are sent back to the Client
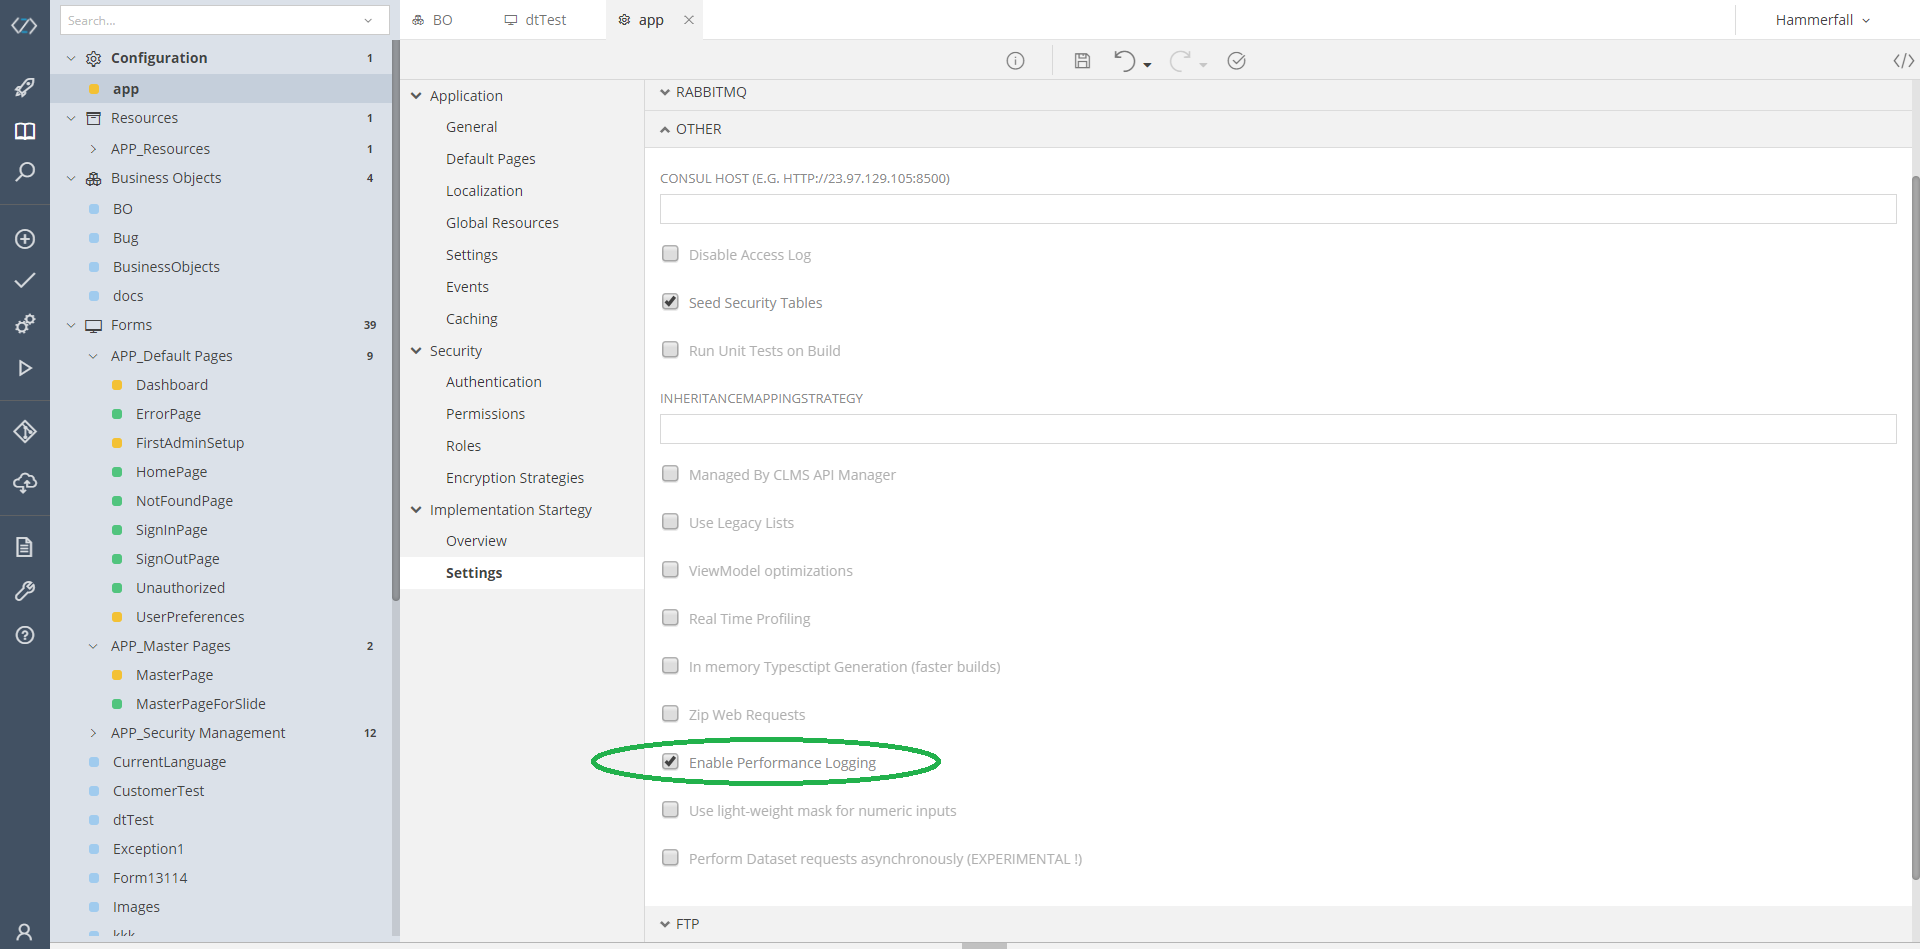
Enable Performance Log
To enable the Performance Logging in your Web Application:
- Go to the Configuration → app section of your Application, in zAppDev
- Find the Implementation Strategy settings
- Open the Other panel
- Check the Enable Performance Logging option
Important
After enabling or disabling this feature, remember to re-build your Application
Monitoring & Logging
Monitoring
All monitors, in their entirety or their parts, can be switched off (disabled). The disabled monitors (and/or parts) will neither run nor log their results. More importantly, the disabled monitors will not even be initialized, thus minimizing the additional RAM requirements for the whole process.
Logging
All monitors described earlier, if and when enabled, log their results in a JSON format, in the Logs\PerformanceLog.txt Rolling Log File. The result logged presents only those items that have a value (are not null) and adhere to at least one configuration rule (see below), for example "have a value larger than X"
Switching On/Off the entire Monitor
The Performance Monitor, in its entirety, can be enabled/disabled in two ways: using the Configuration File of the Application or via the Database.
Via Configuration File
To switch the Performance Monitor on simply open the configuration file of your Application and set the Performance Monitor as enabled:
<performanceMonitor enabled="true">
To switch it off, set it as enabled="false". This way the monitor itself and all its sub-monitors will be disabled.
<performanceMonitor enabled="false">
Via Database
If you wish to avoid altering the configuration file of your Application (that will make your Application restart), you can switch the Performance Monitor using the ApplicationSettings table/Business Object of your Application. By setting the setting with Key = PerformanceMonitor to true (or 1, in the Database) the Performance Monitor will be enabled (along with all its sub-monitors that are set to enabled in the configuration file)
update [security].[ApplicationSettings]
set Value = 1
where Key = 'PerformanceMonitor'
By setting it to false (or 0, in the Database), the Performance Monitor will be disabled (along with all its sub-monitors)
update [security].[ApplicationSettings]
set Value = 0
where Key = 'PerformanceMonitor'
Configuration
The web.config Configuration File of your re-built Generated Application, after Enabling the Performance Logging, will have a new configuration section named performanceMonitor. This section configures the monitored and logged items in a hierarchical way, allowing you to enable/disable the entire procedure, its parts and its sub-parts as you wish.
In the beginning, it will have some default values, logging almost everything that can be logged (except for lists of Entities, Collections etc. in the Database Statistics that only log the Counters to make the log a bit more clear. You can add them too, following the rules described in the next section).
<performanceMonitor enabled="true">
    <controllerAction enabled="true">
      <frontEnd enabled="true" />
      <time enabled ="true" minimumMilliseconds =""/>
      <cpu enabled ="true" minimumPercentage ="1" samplingIntervalMilliseconds="50"/>
      <ram enabled="true" minimumBytes="0" samplingIntervalMilliseconds="50"/>
      <database enabled="true">
        <session enabled="true" ignoreNulls="true"  monitoredStatistics="CloseStatementCount,CollectionFetchCount,CollectionLoadCount,CollectionRecreateCount,CollectionRemoveCount,CollectionUpdateCount,ConnectCount,EntityDeleteCount,EntityFetchCount,EntityInsertCount,EntityLoadCount,EntityUpdateCount,FlushCount,OptimisticFailureCount,PrepareStatementCount,QueryCacheHitCount,QueryCacheMissCount,QueryCachePutCount,QueryExecutionCount,QueryExecutionMaxTime,SecondLevelCacheHitCount,SecondLevelCacheMissCount,SecondLevelCachePutCount,SessionCloseCount,SessionOpenCount,SuccessfulTransactionCount,TransactionCount"></session>
        <entities enabled="true" ignoreNulls="true" monitoredEntities="" monitoredStatistics=""></entities>
      </database>
    </controllerAction>
    <data enabled="true">
      <clientData enabled="true">
        <size enabled="true" minimumBytes="0"></size>
        <time enabled="true" minimumMilliseconds="0"/>
      </clientData>
      <DTO2ViewModel enabled="true">
        <size enabled="true" minimumBytes="0"></size>
        <time enabled="true" minimumMilliseconds=""/>
        <database enabled="true">
          <session enabled="true" ignoreNulls="true"  monitoredStatistics="CloseStatementCount,CollectionFetchCount,CollectionLoadCount,CollectionRecreateCount,CollectionRemoveCount,CollectionUpdateCount,ConnectCount,EntityDeleteCount,EntityFetchCount,EntityInsertCount,EntityLoadCount,EntityUpdateCount,FlushCount,OptimisticFailureCount,PrepareStatementCount,QueryCacheHitCount,QueryCacheMissCount,QueryCachePutCount,QueryExecutionCount,QueryExecutionMaxTime,SecondLevelCacheHitCount,SecondLevelCacheMissCount,SecondLevelCachePutCount,SessionCloseCount,SessionOpenCount,SuccessfulTransactionCount,TransactionCount"></session>
          <entities enabled="true" ignoreNulls="true"></entities>
        </database>
      </DTO2ViewModel>
      <Model2DTO enabled="true">
        <size enabled="true" minimumBytes="0"></size>
        <time enabled="true" minimumMilliseconds=""/>
      </Model2DTO>
    </data>
    <dbFlush enabled="true">
      <time enabled="true" minimumMilliseconds="0"/>
      <database enabled="true">
        <session enabled="true" ignoreNulls="true"  monitoredStatistics="CloseStatementCount,CollectionFetchCount,CollectionLoadCount,CollectionRecreateCount,CollectionRemoveCount,CollectionUpdateCount,ConnectCount,EntityDeleteCount,EntityFetchCount,EntityInsertCount,EntityLoadCount,EntityUpdateCount,FlushCount,OptimisticFailureCount,PrepareStatementCount,QueryCacheHitCount,QueryCacheMissCount,QueryCachePutCount,QueryExecutionCount,QueryExecutionMaxTime,SecondLevelCacheHitCount,SecondLevelCacheMissCount,SecondLevelCachePutCount,SessionCloseCount,SessionOpenCount,SuccessfulTransactionCount,TransactionCount"></session>
        <entities enabled="true" ignoreNulls="true"></entities>
      </database>
    </dbFlush>
</performanceMonitor>
performonanceMonitor
This is the root section of the Performance Monitor. You can set it as enabled="false" to completely disable the Performance Monitoring.
controllerAction
This is the configuration of the Controller Action Monitor and its composing parts. You can switch on and off its Time, CPU, RAM, Front-End and Database statistics, as well as filter them. Their filters are described in the sections that follow:
time Filter
You can filter the time that is logged, setting the minimumMilliseconds threshold (in milliseconds).
<!-- Monitor and Log all measured intervals -->
<time enabled ="true" minimumMilliseconds =""/>

<!-- Monitor and Log all measured intervals -->
<time enabled ="true" minimumMilliseconds ="0"/>

<!-- Monitor and Log those Actions/Parts that took 0.5 minutes or more more than 0.5 minutes -->
<time enabled ="true" minimumMilliseconds ="500"/>
Attention
The default value for this filter is 0. Thus, if not set or invalid, all elapsed milliseconds per Action or part will be logged.
cpu Filter
You can filter the CPU Usage that is logged, setting the minimumPercentage threshold.
<!-- Monitor and Log all measured CPU usages -->
<cpu enabled ="true" minimumPercentage ="" samplingIntervalMilliseconds="50"/>

<!-- Monitor and Log all measured CPU usages -->
<cpu enabled ="true" minimumPercentage ="0" samplingIntervalMilliseconds="50"/>

<!-- Monitor and Log those Actions/Parts that consumed 10% of the CPU or more -->
<cpu enabled ="true" minimumPercentage ="10" samplingIntervalMilliseconds="50"/>
Attention
The default value for the minimumPercentage filter is 0. Thus, if not set or invalid, all calculated CPU usages per Action or part will be logged.
Additionally, you can set the sampling interval of the CPU Monitor. Basically, the CPU Monitor gets samples, at configured intervals, of the CPU Usage. These samples are then converted to their percentage representations that are used to calculate their Average value.
It can be obvious that frequent samples (smaller samplingIntervalMilliseconds values) can give more accurate results. Large (time consuming) Actions (or parts) can have less frequent samples for a rough estimate.
<!-- Get CPU Usage Samples every 50 milliseconds, during the execution of the Action or Part -->
<cpu enabled ="true" minimumPercentage ="" samplingIntervalMilliseconds="50"/>

<!-- Get CPU Usage Samples every second, during the execution of the Action or Part -->
<cpu enabled ="true" minimumPercentage ="0" samplingIntervalMilliseconds=""/>
Attention
The default value for the samplingIntervalMilliseconds value is 1000. Thus, if not set or invalid, the Monitor will capture the CPU Usage once every second.
ram Filter
You can filter the RAM Usage that is logged, setting the minimumBytes threshold, expressed in Bytes.
<!-- Monitor and Log all measured RAM usages -->
<ram enabled="true" minimumBytes="" samplingIntervalMilliseconds="50"/>

<!-- Monitor and Log all measured RAM usages -->
<ram enabled="true" minimumBytes="0" samplingIntervalMilliseconds="50"/>

<!-- Monitor and Log those Action/Parts that consumed 1KB of RAM or more -->
<ram enabled="true" minimumBytes="1024" samplingIntervalMilliseconds="50"/>
Attention
The default value for the minimumBytes filter is 0. Thus, if not set or invalid, all calculated RAM usages per Action or part will be logged.
The RAM Monitor works following the same sampling logic described in the CPU filter section. You can alter the sampling interval of the RAM samples, setting the value of the samplingIntervalMilliseconds option.
database Session Filter
If the Database Monitoring is Enabled, the session configuration sets whether the Session is to be monitored, as well as filters its logged items. Its available sub-filters are:
ignoreNulls
When true, all null and 0 values, calculated by subtracting the Statistics captured before and after a Controller Action's Execution (or a part), will not be logged. Otherwise, all statistics will be logged (to see which, continue reading).
monitoredStatistics This filter can be used in order to log only specific Statistics, instead of writing them all down. It is represented by a comma-delimited string, with the following allowed values:
- CloseStatementCount
- CollectionFetchCount
- CollectionLoadCount
- CollectionRecreateCount
- CollectionRemoveCount
- CollectionRoleNames
- EntityNames
- Queries
- SecondLevelCacheRegionNames
- QueryExecutionMaxTimeQueryString
- CollectionUpdateCount
- ConnectCount
- EntityDeleteCount
- EntityFetchCount
- EntityInsertCount
- EntityLoadCount
- EntityUpdateCount
- FlushCount
- OperationThreshold
- OptimisticFailureCount
- PrepareStatementCount
- QueryCacheHitCount
- QueryCacheMissCount
- QueryCachePutCount
- QueryExecutionCount
- QueryExecutionMaxTime
- SecondLevelCacheHitCount
- SecondLevelCacheMissCount
- SecondLevelCachePutCount
- SessionCloseCount
- SessionOpenCount
- SuccessfulTransactionCount
- TransactionCount
<!-- Monitor the Database Session, ignore zero calculated values and log every statistic available -->
<session enabled="true" ignoreNulls="true"  monitoredStatistics=""></session>

<!-- Monitor the Database Session, ignore zero calculated values and log only the Number of Transactions -->
<session enabled="true" ignoreNulls="true"  monitoredStatistics="TransactionCount"></session>

<!-- Monitor the Database Session, ignore zero calculated values and log the Insert, Update and Delete Statements Count -->
<session enabled="true" ignoreNulls="true"  monitoredStatistics="EntityInsertCount, EntityUpdateCount, EntityDeleteCount"></session>

<!-- Monitor the Database Session and log the Insert, Update and Delete Statements Count even if their counters have not changed during the execution -->
<session enabled="true" ignoreNulls="false"  monitoredStatistics="EntityInsertCount, EntityUpdateCount, EntityDeleteCount"></session>
Attention
The default values of the filters described previously are:
- ignoreNulls =
true - monitoredStatistics = all
database Entities Filter
If the Database Monitoring is Enabled, the entities configuration sets whether the Entities and Collections are to be monitored, as well as filters their logged items. Its available sub-filters are presented in the sections that follow.
Hint
Entities are simple Business Objects, such as: ApplicationUser or ApplicationUserRole Collections are lists that reside inside a Business Object, for example: ApplicationUser.Permissions or ApplicationUser.Roles
ignoreNulls
When true, all null and 0 values, calculated by subtracting the Statistics captured before and after a Controller Action's Execution (or a part), will not be logged. Otherwise, all statistics will be logged (to see which, continue reading).
monitoredStatistics This filter can be used in order to log only specific Statistics, instead of writing them all down. It is represented by a comma-delimited string, with the following allowed values:
- LoadCount (valid for both Entities & Collections)
- UpdateCount (valid for both Entities & Collections)
- InsertCount (valid for Entities)
- DeleteCount(valid for both Entities & Collections)
- FetchCount(valid for both Entities & Collections)
- OptimisticFailureCount(valid for Entities)
- RecreateCount(valid for Collections)
<!-- Monitor the Database Entities and Collections, ignore zero calculated values and log every statistic available -->
<entities enabled="true" ignoreNulls="true" monitoredEntities="" monitoredStatistics=""></entities>

<!-- Monitor the Database Entities and Collections, ignore zero calculated values and log only the Number of Inserted items -->
<entities enabled="true" ignoreNulls="true" monitoredEntities="" monitoredStatistics="InsertCount"></entities>

<!-- Monitor the Database Entities and Collections, ignore zero calculated values and log the Update and Delete Statements Count -->
<entities enabled="true" ignoreNulls="true"  monitoredStatistics="UpdateCount, DeleteCount"></session>
monitoredEntities
By default, all available Entities and Collections will be monitored, calculated and logged (always with regards to all other filters). If you wish to log only a subset of those, ignoring some Entities & Collections you do not want to be present in the Log, you can configure them using the comma-delimited monitoredEntities option.
<!-- All Entities & Collections will be monitored (and logged only if they where altered during the Monitoring) -->
<entities enabled="true" ignoreNulls="true" monitoredEntities="" monitoredStatistics=""></entities>

<!-- Only the ApplicationUser Entity will be Monitored (and logged only if they where altered during the Monitoring) -->
<entities enabled="true" ignoreNulls="true" monitoredEntities="ApplicationUser" monitoredStatistics=""></entities>

<!-- Only the ApplicationUser, ApplicationRole and Store Entities will be Monitored (and logged only if they where altered during the Monitoring) -->
<entities enabled="true" ignoreNulls="true" monitoredEntities="ApplicationUser, ApplicationRole, Store" monitoredStatistics=""></entities>
Attention
The default values of the filters described previously are:
- ignoreNulls =
true - monitoredStatistics = all
- monitoredEntities = all Entities & Collections captured by the NHibernate Statistics
clientData
This is the configuration of the Client Data Monitor and its composing parts.Its filters are described in the sections that follow:
size Filter
You can filter the logged Data, based on its Size, setting the minimumBytes threshold (in Bytes).
<!-- Log any Size -->
<size enabled="true" minimumBytes=""></size>

<!-- Log any Size -->
<size enabled="true" minimumBytes="0"></size>

<!-- Log only if the Data is 1KB or larger -->
<size enabled="true" minimumBytes="1024"></size>
Attention
The default value for the minimumBytes filter is 0.
time Filter
You can filter the logged Data with regards to the Time it took to convert the latter from one type to another, using the minimumMilliseconds threshold.
<!-- Log, regardless of the Elapsed Time -->
<time enabled="true" minimumMilliseconds=""/>

<!-- Log, regardless of the Elapsed Time -->
<time enabled="true" minimumMilliseconds="0"/>

<!-- Log, if it took 2 seconds or more to convert the Data -->
<time enabled="true" minimumMilliseconds="2000"/>
Attention
The default value for the minimumMilliseconds filter is 0.
DTO2ViewModel
This is the Configuration of the DTO to ViewModel Conversion Monitor. At this point its underlying configuration, filters and default values are considered known.
Model2DTO
This is the Configuration of the Response Monitor. At this point its underlying configuration, filters and default values are considered known.
dbFlush
This is the Configuration of the Database Flush Monitor. At this point its underlying configuration, filters and default values are considered known.
Results
Overview
All the selected measurements, as mentioned, are saved in a JSON format in the PerformanceLog.txt Rolling Log File. Each JSON record presents one Controller (and Action, in the case of a Back-End Measurements cycle) with all of its Metrics that have been enabled by the configuration. The following sample presents a snippet of such a log, with all sub-monitors and their statistics enabled, showing two records:
- A HomePage.Render Action logging back-end measurements ( Controller: HomePage, Action: Render)
- A UsersList Controller logging front-end measurements
Note
To minify the logged information in this sample, some information was deleted and substituted with [...]
{
  "Controller": "HomePage",
  "Action": "Render",
  "UserHostAddress": "192.168.2.40",
  "DateTime": "2019-07-17 16:17:39,957",
  "ControllerActionStatistics": {
    "UsageStatistics": {
      "ElapsedMilliseconds": 47,
      "AverageCPU": 0.0,
      "AverageRAM": 1.01195776E+09
    },
    "NHStatistics": {
      "NHEntityStatistics": [
        {
          "EntityName": "CLMS.Framework.Identity.Model.Profile",
          "LoadCount": 1,
          "FetchCount": 1,
          "EntityType": "Entity"
        }
      ],
      "NHSessionStatistics": {
        "EntityLoadCount": 1,
        "EntityFetchCount": 1,
        "QueryExecutionMaxTime": "00:00:00",
        "QueryExecutionMaxTimeQueryString": ".Where[CLMS.Framework.Identity.Model.ApplicationPermission, CLMS.Framework, Version=7.0.0.0, Culture=neutral, PublicKeyToken=null](NHibernate.Linq.NhQueryable`1[CLMS.Framework.Identity.Model.ApplicationPermission], Quote((a, ) => (String.op_Inequality(a.Name, NULL))), )",
        "QueryCacheHitCount": 1,
        "SecondLevelCacheMissCount": 1,
        "SecondLevelCachePutCount": 1,
        "SessionCloseCount": 1,
        "Queries": [
          ".Where[CLMS.Framework.Identity.Model.ApplicationPermission, CLMS.Framework, Version=7.0.0.0, Culture=neutral, PublicKeyToken=null](NHibernate.Linq.NhQueryable`1[CLMS.Framework.Identity.Model.ApplicationPermission], Quote((a, ) => (String.op_Inequality(a.Name, NULL))), )",
          ".Where[CLMS.Framework.Identity.Model.ApplicationOperation, CLMS.Framework, Version=7.0.0.0, Culture=neutral, PublicKeyToken=null](NHibernate.Linq.NhQueryable`1[CLMS.Framework.Identity.Model.ApplicationOperation], Quote((a, ) => (String.op_Inequality(a.Name, NULL))), )",
          [...]
        ],
        "EntityNames": [
          "CLMS.Framework.Auditing.Model.AuditEntityConfiguration",
          "CLMS.Framework.Auditing.Model.AuditLogEntry",
          "CLMS.Framework.Auditing.Model.AuditLogEntryType",
          [...]
        ],
        "CollectionRoleNames": [
          "CLMS.Framework.Auditing.Model.AuditEntityConfiguration.Properties",
          "CLMS.Framework.Identity.Model.ApplicationOperation.Permissions",
          [...]
        ],
        "SecondLevelCacheRegionNames": [
          "security",
          "audit"
        ],
        "SuccessfulTransactionCount": 1,
        "TransactionCount": 1,
        "PrepareStatementCount": 1,
        "CloseStatementCount": 1,
        "OperationThreshold": "00:00:00"
      }
    }
  },
  "RequestStatistics": {
    "ElapsedMilliseconds": 0,
    "DataSize": 0.0
  },
  "ResponseStatisticsPreAction": {
    "ElapsedMilliseconds": 0,
    "DataSize": 0.0
  },
  "ResponseStatisticsPostAction": {
    "ElapsedMilliseconds": 0,
    "DataSize": 0.0
  },
  "ConversionStatistics": {
    "ElapsedMilliseconds": 0,
    "DataSize": 0.0
  },
  "DatabaseFlushStatistics": {
    "ElapsedMilliseconds": 3,
    "NHStatistics": {
      "NHSessionStatistics": {
        "QueryExecutionMaxTime": "00:00:00",
        "QueryExecutionMaxTimeQueryString": ".Where[CLMS.Framework.Identity.Model.ApplicationPermission, CLMS.Framework, Version=7.0.0.0, Culture=neutral, PublicKeyToken=null](NHibernate.Linq.NhQueryable`1[CLMS.Framework.Identity.Model.ApplicationPermission], Quote((a, ) => (String.op_Inequality(a.Name, NULL))), )",
        "SessionCloseCount": 1,
        "Queries": [
          ".Where[CLMS.Framework.Identity.Model.ApplicationPermission, CLMS.Framework, Version=7.0.0.0, Culture=neutral, PublicKeyToken=null](NHibernate.Linq.NhQueryable`1[CLMS.Framework.Identity.Model.ApplicationPermission], Quote((a, ) => (String.op_Inequality(a.Name, NULL))), )",
          ".Where[CLMS.Framework.Identity.Model.ApplicationOperation, CLMS.Framework, Version=7.0.0.0, Culture=neutral, PublicKeyToken=null](NHibernate.Linq.NhQueryable`1[CLMS.Framework.Identity.Model.ApplicationOperation], Quote((a, ) => (String.op_Inequality(a.Name, NULL))), )",
          [...]
        ],
        "EntityNames": [
          "CLMS.Framework.Auditing.Model.AuditEntityConfiguration",
          "CLMS.Framework.Auditing.Model.AuditLogEntry",
          "CLMS.Framework.Auditing.Model.AuditLogEntryType",
          [...]
        ],
        "CollectionRoleNames": [
          "CLMS.Framework.Auditing.Model.AuditEntityConfiguration.Properties",
          "CLMS.Framework.Identity.Model.ApplicationOperation.Permissions",
          "CLMS.Framework.Identity.Model.ApplicationPermission.Users",
          [...]
        ],
        "SecondLevelCacheRegionNames": [
          "security",
          "audit"
        ],
        "SuccessfulTransactionCount": 1,
        "TransactionCount": 1,
        "OperationThreshold": "00:00:00"
      }
    }
  }
},
{
  "Controller": "UsersList",
  "UserHostAddress": "192.168.2.40",
  "DateTime": "2019-07-17 16:18:01,344",
  "FrontEndStatistics": [
    {
      "Action": "_UIRender",
      "ElapsedMilliseconds": 0.845
    },
    {
      "Action": "_UpdateViewModel",
      "ElapsedMilliseconds": 0.390000015
    },
    {
      "Action": "_ModelAssignment",
      "ElapsedMilliseconds": 0.149999991
    },
    {
      "Action": "_RuleEngine",
      "ElapsedMilliseconds": 0.36
    },
    {
      "Action": "_ExecuteControllerAction",
      "Information": "UsersList/LoadListViews",
      "ElapsedMilliseconds": 158.105
    }
  ]
},
Interpretation
Back-End
- Controller : The name of the Controller for which the back-end metrics are being measured
- Action: The controller Action for which the back-end metrics are being measured
- UserHostAddress: IP Address of the User running the Application
- DateTime: Date and Time of the request
- ControllerActionStatistics
- UsageStatistics: Time, CPU and RAM Usage statistics measured for any Action between its OnActionExecuting and OnActionExecuted events
- ElapsedMilliseconds: Time, in milliseconds, for the whole Action to finish either successfully or in failure
- AverageCPU: Average CPU measured during the current action. The metrics follow the sampling described: Every IntervalMilliseconds (set in the configuration of this monitor) the monitor samples the current Process for its ProcessorTime value and stores it. At the end of the Action, the Average or all ProcessorTimes is calculated.
- AverageRAM: Average RAM, in bytes, during the current action. The metrics follow the sampling described: Every IntervalMilliseconds (set in the configuration of this monitor) the monitor samples the current Process for its VirtualMemorySize and stored it. At the end of the Action, the Average of all values is calculated.
- NHStatistics
- NHEntityStatistics
- EntityName
- LoadCount
- FetchCount
- EntityType
- NHSessionStatistics ( Explanations taken from here )
- CloseStatementCount: The number of prepared statements that were released
- CollectionFetchCount: Global number of collections fetched
- CollectionLoadCount: Global number of collections loaded
- CollectionRecreateCount: Global number of collections recreated
- CollectionRemoveCount: Global number of collections removed
- CollectionRoleNames: The names of all collection roles
- EntityNames: The names of all entities
- Queries: All executed query strings
- SecondLevelCacheRegionNames: Get all second-level cache region names
- QueryExecutionMaxTimeQueryString: The query string for the slowest query.
- CollectionUpdateCount: Global number of collections updated
- ConnectCount: Get the global number of connections asked by the sessions (the actual number of connections used may be much smaller depending whether you use a connection pool or not)
- EntityDeleteCount: Global number of entity deletes
- EntityFetchCount: Global number of entity fetches
- EntityInsertCount: Global number of entity inserts
- EntityLoadCount: Global number of entity loads
- EntityUpdateCount: Global number of entity updates
- FlushCount: Get the global number of flush executed by sessions (either implicit or explicit)
- OperationThreshold: The OperationThreshold to a value greater than MinValue to enable logging of long running operations.
- OptimisticFailureCount: The number of StaleObjectStateExceptions that occurred
- PrepareStatementCount: The number of prepared statements that were acquired
- QueryCacheHitCount: The global number of cached queries successfully retrieved from cache
- QueryCacheMissCount: The global number of cached queries not found in cache
- QueryCachePutCount: The global number of cacheable queries put in cache
- QueryExecutionCount: Global number of executed queries
- QueryExecutionMaxTime: The TimeSpan of the slowest query.
- SecondLevelCacheHitCount: Global number of cacheable entities/collections successfully retrieved from the cache
- SecondLevelCacheMissCount: Global number of cacheable entities/collections not found in the cache and loaded from the database.
- SecondLevelCachePutCount: Global number of cacheable entities/collections put in the cache
- SessionCloseCount: Global number of sessions closed
- SessionOpenCount: Global number of sessions opened
- SuccessfulTransactionCount: The number of transactions we know to have been successful
- TransactionCount: The number of transactions we know to have completed
- NHEntityStatistics
- RequestStatistics: Statistics measured as soon as a new Request comes from the Browser to the Server
- ElapsedMilliseconds: The time, in milliseconds, required to deserialize and desanitize the posted stringified JSON data and convert it into a View Model to be used in the next steps of the procedure
- DataSize: The bytes of the original stringified JSON
- ResponseStatisticsPreAction: Statistics measured when the server responds to the client, in the case that the Action never runs (for example, if a Validation error occurs, so the Controller posts a Response back immediately without actually executing the next steps of the Action). Normally, the response contains an error message for the user.
- ElapsedMilliseconds: The time, in milliseconds, required to serialize the response
- DataSize: The bytes of the stringified JSON response that will be sent to the client
- ResponseStatisticsPostAction: Statistics measured when the server responds to the client after executing a controller Action
- ElapsedMilliseconds: The time, in milliseconds, required to serialize the response
- DataSize: The bytes of the serialized JSON response that will be sent to the client. In this case, only the viewDTO is being measured, calculating only the actual payload (i.e. Data)
- ConversionStatistics: Time, in milliseconds required for the server to: Get Seen Model Instance (if exists, or create a new ViewModel), Hydrate it(and all its nested classes, using the original seen ViewModel )
- ElapsedMilliseconds: Time needed for aforementioned conversion
- DatabaseFlushStatistics: Statistics calculated during the persistence of data into the Application's Database
- ElapsedMilliseconds: Time, in milliseconds, required to Flush (persist) all Data to the Database
- NHStatistics: Aforementioned collection of statistics
- UsageStatistics: Time, CPU and RAM Usage statistics measured for any Action between its OnActionExecuting and OnActionExecuted events
Front-End
- Controller : The name of the Controller for which the front-end metrics are being measured
- UserHostAddress: IP Address of the User running the Application
- DateTime: Date and Time of the request
- FrontEndStatistics
- Action: Name of the action (procedure or block of code) performed by the front-end code that is being measured (see below, for the available Actions)
- ElapsedMilliseconds: Milliseconds elapsed during the whole process of the action (procedure or block of code)
- Information: Additional information (e.g. part of the URL called via a GET/POST AJAX call during a ExecuteControllerAction type of Action)
Types of Actions:
- UIRender: All processes running between the DomContentLoaded and the window.load events. Basically, this action holds anything required for the browser graphics to load
- UpdateViewModel: Functionality required to obtain the stringified JSON Model from the Back-End, optimize it, dehydrate it and convert it into the actual View Model used by the Form
- ModelAssignment: Model Assignment functionality, required for the View Model to be initialzed and hydrated by its original representation
- RuleEngine: All processes that are executed by the Rule Engine as soon as the page is loaded, such as Conditional Formattings, Data Validations and Calculated Expressions
- ExecuteControllerAction: All processes running during the success callback called after any back-end Controller Action (i.e. any Action that is executed in the back-end via an AJAX call)
Appendix
Overhead
This section will present the total Overhead (in milliseconds), using three cases:
- An application running all monitors with all metrics enabled
- An application having the Performance Monitor installed, but disabled
- An application running without the Performance Monitor installed (it will not be present even in terms of classes)
In all cases, the exact same scenario was ran:
- A user opens an empty Application (meaning that no custom forms are created bar for the default ones that zAppDev has added)
- The Home Page is opened
- The user logs out
- The user logs in
- The user visits the page with all other Users
- The user creates a new User assigning him/her the first three Permissions and the "Administrator" role
- The user reopens the newly created User and closes his/her page
- The user visits the home page
To measure the time required for each step, a StopWatch has been added to each Controller Action, starting at the very first line of its OnActionExecuting and stopping at the very last line of its OnActionExecuted callback. The Milliseconds elapsed for each Controller Actions where written into a log file and then compared to each other: action by action and in total.
Notation
- Without PM: The Performance Monitor is completely uninstalled
- With PM but Off: The Performance Monitor is installed, but set as disabled
- With PM: The Performance Monitor is installed and completely enabled
| Controller | Action | Without PM | With PM but Off | With PM |
|---|---|---|---|---|
| HomePage | Render | 28 | 26 | 44 |
| HomePage | _API_Render | 7 | 9 | 14 |
| SignOutPage | SignOut | 1 | 1 | 4 |
| SignOutPage | _API_SignOut | 110 | 108 | 115 |
| SignInPage | Load | 1 | 1 | 4 |
| SignInPage | _API_Load | 65 | 57 | 61 |
| SignInPage | SignIn | 111 | 110 | 105 |
| HomePage | Render | 31 | 27 | 91 |
| HomePage | _API_Render | 10 | 17 | 66 |
| UsersList | Retrieve | 2 | 1 | 26 |
| UsersList | _API_Retrieve | 7 | 6 | 13 |
| UsersList | LoadListViews | 4 | 6 | 9 |
| UsersList | List_Datasource | 95 | 104 | 80 |
| ManageUser | NewUser | 2 | 2 | 6 |
| ManageUser | _API_NewUser | 10 | 11 | 15 |
| ManageUser | SaveUser | 97 | 57 | 59 |
| UsersList | List_Datasource | 107 | 118 | 149 |
| ManageUser | EditUser | 2 | 2 | 31 |
| ManageUser | _API_EditUser | 3 | 3 | 11 |
| UsersList | List_Datasource | 110 | 123 | 172 |
| HomePage | Render | 32 | 29 | 98 |
| HomePage | _API_Render | 15 | 22 | 95 |
| Totals | 850 | 840 | 1268 |
It can be seen that whether the Performance Logger is completely uninstalled or just disabled, there is no additional overhead to the system. When completely enabled, though, it adds up to ~418ms to the whole described procedure.
Author
Contact the Author of this document for any further information and inquiry. Keep in mind that your questions and proposals will help us maintain and extend the Performance Monitor and its Documentation.